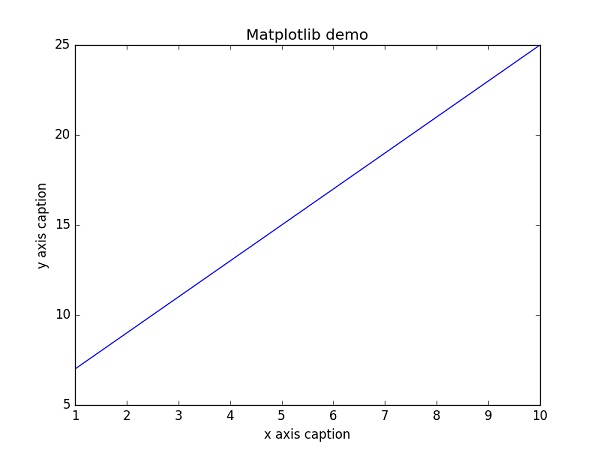
class: center, middle, inverse, title-slide # 金融研究报告撰写 ## 数据绘图与展示 ### 吴燕丰 ### 江西财大,金融学院 ### 2020/12/24, updated on 2022-06-10 --- class: middle, center ## 数据绘图与展示 --- ### Matplotlib Matplotlib 是 Python 的绘图库。 安装(通过Anaconda Prompt命令行窗口): ```bash pip install matplotlib -i https://pypi.tuna.tsinghua.edu.cn/simple ``` **提示**:如果没安装 NumPy 库,也请安装。 --- ### Matplotlib Pyplot **Pyplot** Most of the **Matplotlib** utilities lies under the **pyplot** submodule, and are usually imported under the **plt** alias: ```python import matplotlib.pyplot as plt ``` --- ### Draw a Line Draw a Line from **point (0,0)** to **point (6,250)**. .pull-left[ ```python import matplotlib.pyplot as plt import numpy as np xpoints = np.array([0, 6]) ypoints = np.array([0, 250]) plt.plot(xpoints, ypoints) plt.show() ``` ] .pull-right[  ] --- ### Adding x, y axis labels and title 添加X、Y轴标签、图标题 .pull-left[ ```python import numpy as np from matplotlib import pyplot as plt x = np.arange(1,11) y = 2 * x + 5 plt.title("Matplotlib demo") plt.xlabel("x axis caption") plt.ylabel("y axis caption") plt.plot(x,y) plt.show() ``` ] .pull-right[  ] --- ### 设置中文 .pull-left[ ```python import numpy as np import matplotlib.pyplot as plt import matplotlib.font_manager as fm # 字体的路径 fname = "C:\Windows\Fonts\SIMLI.TTF" zhfont1 = fm.FontProperties(fname=fname) plt.rcParams['figure.dpi'] = 300 x = np.arange(1,11) y = 2 * x + 5 plt.title("YYschools - 测试", fontproperties=zhfont1) # fontproperties 设置中文显示,fontsize 设置字体大小 plt.xlabel("x 轴", fontproperties=zhfont1) plt.ylabel("y 轴", fontproperties=zhfont1) plt.plot(x,y) plt.savefig('中文标签.svg') ``` ] .pull-right[  ] .footnote[来源:菜鸟教程] --- ### Matplotlib Markers **Markers**: You can use the keyword argument marker to emphasize each point with a specified marker: .pull-left[ ```python import matplotlib.pyplot as plt import numpy as np ypoints = np.array([3, 8, 1, 10]) plt.plot(ypoints, marker = 'o') plt.show() ``` ] .pull-right[  ] --- ### Marker Reference |Marker|Description|Marker|Description| |------|-----------|------|-----------| |'o'| Circle|'*'| Star| |'.'| Point|','| Pixel| |'x'| X|'X'| X (filled)| |'+'| Plus|'P'| Plus (filled)| |'s'| Square|'D'| Diamond| |'d'| Diamond (thin)|'p'| Pentagon| |'H'| Hexagon|'h'| Hexagon| |'v'| Triangle Down|'^'| Triangle Up| |'<'| Triangle Left|'>'| Triangle Right| |'1'| Tri Down|'2'| Tri Up| |'3'| Tri Left|'4'| Tri Right| |'|'| Vline|'_'| Hline| --- ### Matplotlib Scatter With **Pyplot**, you can use the **scatter()** function to draw a scatter plot. .pull-left[ ```python import matplotlib.pyplot as plt import numpy as np x = np.array([5,7,8,7,2,17,2,9,4,11,12,9,6]) y = np.array([99,86,87,88,111,86,103,87,94,78,77,85,86]) plt.scatter(x, y) plt.show() ``` ] .pull-right[  ] --- ### Compare Plots Draw **two plots** on the same figure: .pull-left[ ```python import matplotlib.pyplot as plt import numpy as np #day one, the age and speed of 13 cars: x = np.array([5,7,8,7,2,17,2,9,4,11,12,9,6]) y = np.array([99,86,87,88,111,86,103,87,94,78,77,85,86]) plt.scatter(x, y) #day two, the age and speed of 15 cars: x = np.array([2,2,8,1,15,8,12,9,7,3,11,4,7,14,12]) y = np.array([100,105,84,105,90,99,90,95,94,100,79,112,91,80,85]) plt.scatter(x, y) plt.show() ``` ] .pull-right[  ] --- ### Matplotlib Bars With **Pyplot**, you can use the **bar()** function to draw bar graphs: .pull-left[ ```python import matplotlib.pyplot as plt import numpy as np x = np.array(["南昌", "九江", "上饶", "赣州"]) y = np.array([3, 8, 1, 10]) plt.xticks(fontproperties=zhfont1) plt.bar(x,y) plt.show() ``` ] .pull-right[  ] --- ### Matplotlib Histograms A **histogram** is a graph showing **frequency distributions**. .pull-left[ ```python import matplotlib.pyplot as plt import numpy as np x = np.random.normal(170, 10, 250) plt.hist(x) plt.show() ``` ] .pull-right[  ] --- ### Matplotlib Pie Charts With **Pyplot**, you can use the **pie()** function to draw pie charts: .pull-left[ ```python import matplotlib.pyplot as plt import numpy as np y = np.array([35, 25, 25, 15]) mylabels = ["Apples", "Bananas", "Cherries", "Dates"] plt.pie(y, labels = mylabels) plt.show() ``` ] .pull-right[  ] --- ### 参考资料 - https://www.runoob.com/numpy/numpy-matplotlib.html - https://matplotlib.org/tutorials/introductory/pyplot.html --- class: middle, center ## 撰写报告 --- ### 编写报告--Jupyter Notebook 打开 Jupyter Notebook  **切换文件夹|目录**: `Windows`下利用`cmd`指令`cd`(**c**hange **d**irectory: cd)进入指定文件夹(也叫目录): - 若要进入非C盘,比如D盘,则用`d:`,E盘,则用`e:`; - 如果,文件夹名称有空格,则用英文双引号引起来,比如"`Program Files`"; - 若要进入上一级目录,则用`cd ..`; - 若要采用绝对路径文件夹名,则用`cd c:\folder1\folder11\folder111`类似命令。 下一页续 --- ### 从指定文件夹打开Jupyter Notebook 如果想从指定的文件夹,比如`Documents`打开Jupyter Notebook,则先用`cd`命令,进入该文件夹,然后再打开Jupyter Notebook:  若要从非C盘某文件夹,比如`E:\Program Files`,开启Jupyter Notebook,则先用`e:`进入E盘,然后操作类似上面步骤:  --- ### 界面  --- ### 示例 .center[ <img width=650 src='./images/jupyter_notebook_sample.png'> ] --- ### demo - 插入代码 - 插入Markdown元素 下载 - <a download href='documentation.ipynb'>documentation.ipynb</a> - <a download href='pyplot.ipynb'>pyplot.ipynb</a> --- ### Code  --- ### Markdown  --- ### Jupyter 不能正确连接  详细介绍与解决方案: [jupyter_connecting_problem](../../application/jupyter_connecting_problem/jupyter_connecting_problem.html) --- class: middle, center ### 制作幻灯片 ### RStudio --- ### R + RStudio + xaringan package 1. [Download R](https://mirrors.tuna.tsinghua.edu.cn/CRAN/) 2. [Download RStudio Desktop](https://www.rstudio.com/products/rstudio/download/) 3. 安装 `xaringan` package: RStudio菜单Tools -> Install Packages .center[ <img width=400 src='./images/install_packages.png'> ] 4. 也安装 `xaringanthemer` package --- ### Rmarkdown .center[ <img width=500 src='./images/newRmarkdown.png'> ] --- ### xaringan 幻灯片 .center[ <img width=500 src='./images/newPresentation.png'> ] --- ### 撰写+预览 在控制台(Console)输入 '`xaringan::inf_mr()`'指令,可实现撰写的同时预览。 .center[ <img width=800 src='./images/preview.png'> ]