B.操作代码
'''
第一步,根据学生姓名自动挑选出所分配行业于深市上市的公司(第一家或随机)
'''
pdf = pdfplumber.open('行业分类表.pdf')
table = pdf.pages[0].extract_table()
for i in range(len(table)):
if table[i][1] == None:
table[i][1] = table[i-1][1]
asign = pd.read_csv('行业安排表.csv',converters={'行业':str})[['行业','完成人']]
Names = InputStu()
MatchedI = Match(Names,asign)
sz = Get_sz(table)
sh = Get_sh(table)
df_sz = Getcompany(MatchedI,sz)
df_sh = Getcompany(MatchedI,sh)
Company = df_sz[['上市公司代码','上市公司简称']]
Company2 = df_sh[['上市公司代码','上市公司简称']]
My_Company=Company.append(Company2)
My_Company.to_csv('company.csv',encoding='utf-8-sig')
'''
第二步爬取所需公司年报
'''
print('\n(爬取网页中......)')
browser = webdriver.Edge()#这里别忘了根据个人浏览器选择
browser.get('https://www.szse.cn/disclosure/listed/fixed/index.html')
End = time.strftime('%Y-%m-%d', time.localtime())
InputTime('2012-01-01',End)
SelectReport(4) # 调用函数,选择“年度报告”
Clickonblank()
#在深交所官网爬取深交所上市公司年报下载链接
for index,row in Company.iterrows():
code = row[0]
name = row[1].replace('*','')
SearchCompany(code)
time.sleep(0.5) # 延迟执行0.5秒,等待网页加载
html = browser.find_element(By.ID, 'disclosure-table')
innerHTML = html.get_attribute('innerHTML')
Save(name,innerHTML)
Clearicon()
#在新浪财经爬取上交所上市公司年报下载链接
for index,row in Company2.iterrows():
code = row[0]
name = row[1].replace('*','')
browser.get('https://vip.stock.finance.sina.com.cn/corp/go.php/vCB_Bulletin
/stockid/%s/page_type/ndbg.phtml'%code)
html = browser.find_element(By.CLASS_NAME, 'datelist')
innerHTML = html.get_attribute('innerHTML')
Save(name,innerHTML)
browser.quit()
'''
第三步,解析html获取年报表格存储到本地并下载年报文件
'''
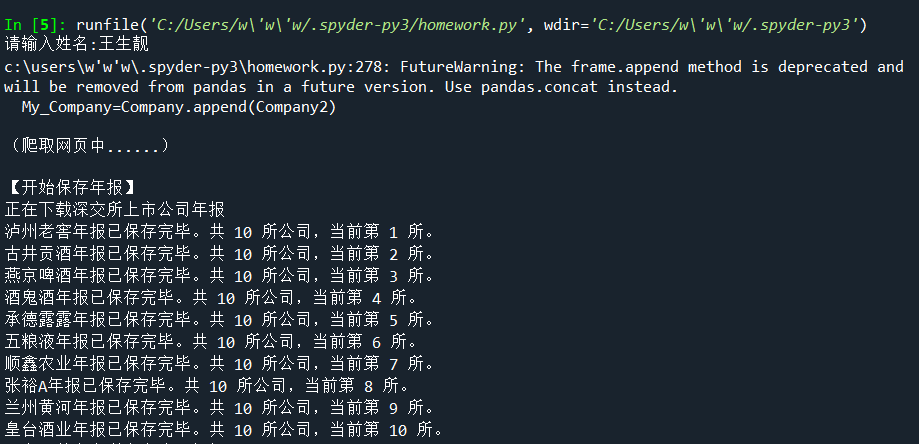
print('\n【开始保存年报】')
print('正在下载深交所上市公司年报')
i = 0
for index,row in Company.iterrows():
i+=1
name = row[1].replace('*','')
html = Readhtml(name)
dt = DisclosureTable(html)
df = dt.get_data()
df1 = tidy(df)
df1.to_csv(name+'.csv',encoding='utf-8-sig')
os.makedirs(name,exist_ok=True)#创建用于放置下载文件的子文件夹
os.chdir(name)
Loadpdf(df1)
print(name+'年报已保存完毕。共',len(Company),'所公司,当前第',i,'所。')
os.chdir('../') #将当前工作目录爬到父文件夹,防止下一次循环找不到html文件
print('正在下载上交所上市公司年报')
j=0
for index,row in Company2.iterrows():
j+=1
name= row[1].replace('*','')
html = Readhtml(name)
df = sina_to_dataframe(name)
df1 = tidy(df)
df1.to_csv(name+'.csv',encoding='utf-8-sig')
os.makedirs(name,exist_ok=True)#创建用于放置下载文件的子文件夹
os.chdir(name)
Loadpdf(df1)
print(name+'年报已保存完毕。共',len(Company2),'所公司,当前第',j,'所。')
os.chdir('../') #将当前工作目录爬到父文件夹,防止下一次循环找不到html文件
结果如下:
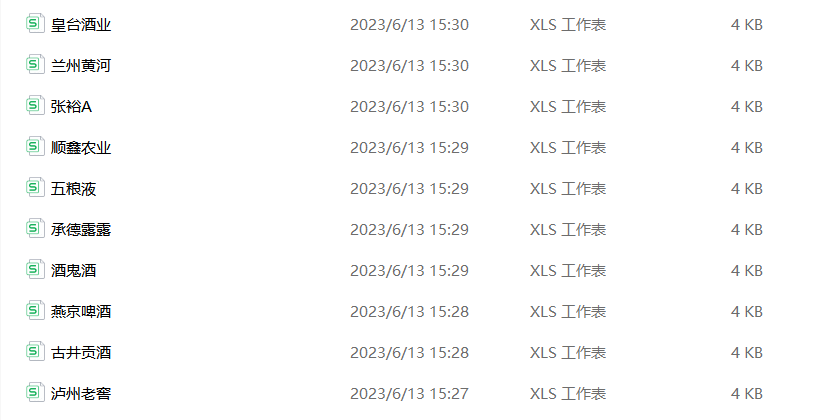
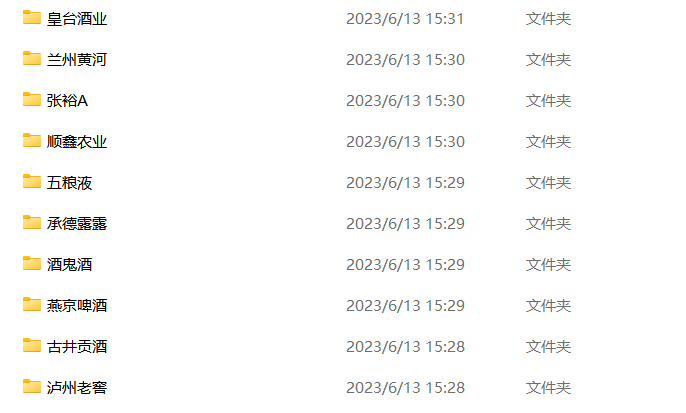
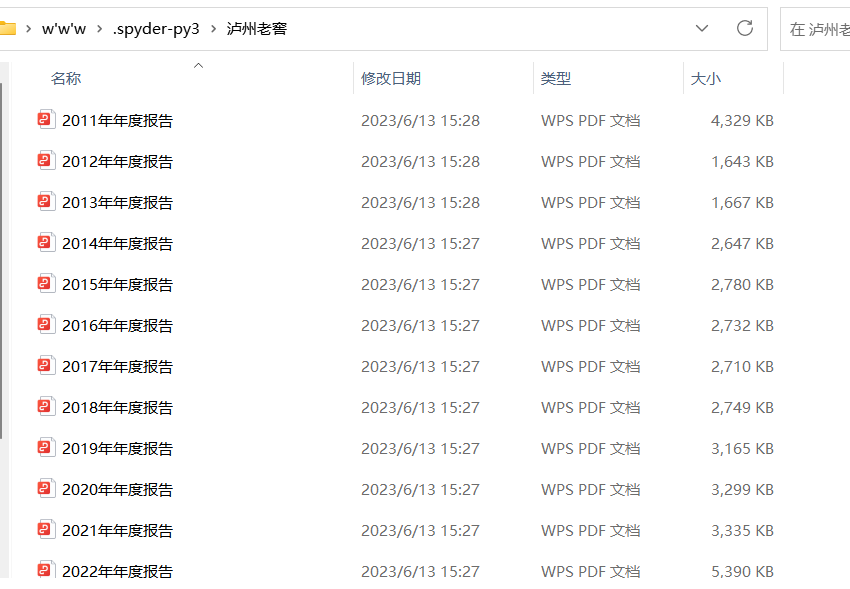
爬取下来的源码(html格式),解析成dataframe的表格(csv格式),自动下载的年报(pdf格式)
各公司查询近十年年报结果源码
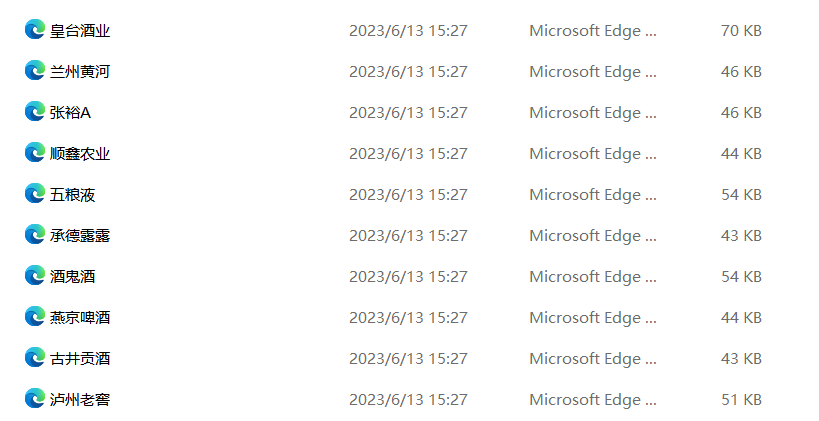
网页爬取中
解析后得到的表格
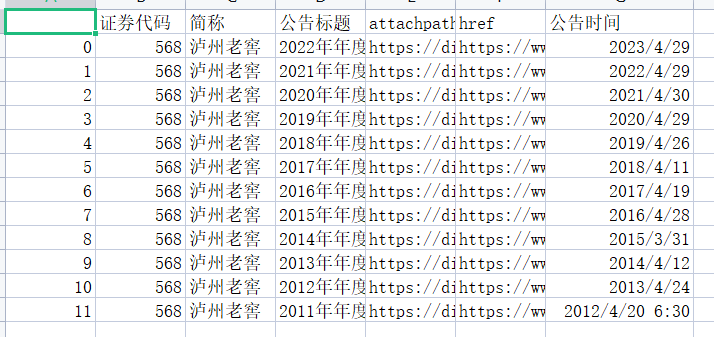
通过访问表格"attachpath"栏自动下载的年报
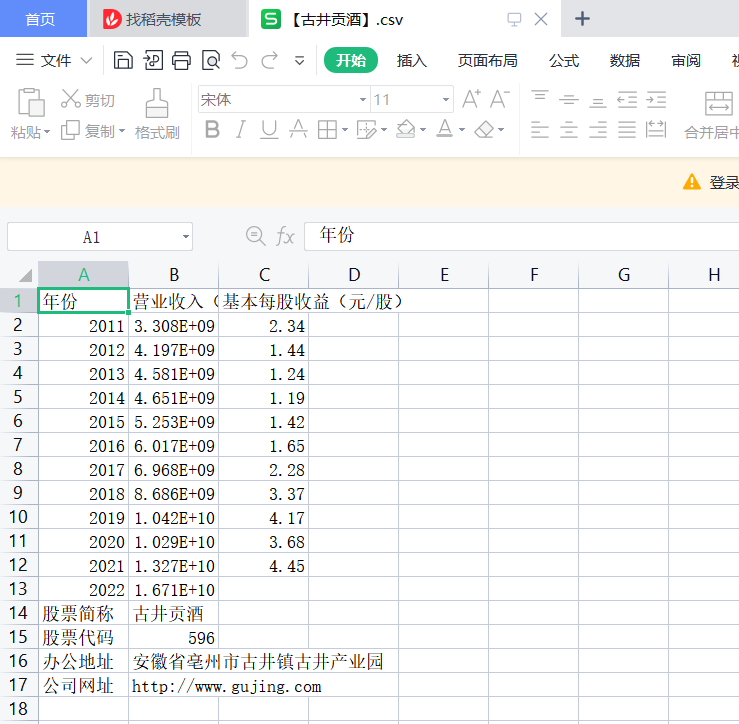
提取“营业收入(元)”、“基本每股收益(元 ╱ 股)”、“归属于上市公司股东的净利润(元)”
“股票简称”、“股票代码”、“办公地址”、“公司网址”
import pandas as pd
import fitz
import re
Company=pd.read_csv('company.csv').iloc[:,1:]
company=Company.iloc[:,1].tolist()
t=0
for com in company:
t+=1
com=com.replace('*','')
df = pd.read_csv(com+'.csv',converters={'证券代码':str})
df = df.sort_index(ascending=False)
final = pd.DataFrame(index=range(2011,2022),columns=['营业收入
(元)','基本每股收益(元/股)','归属于上市公司股东的净利润(元)'])
final.index.name='年份'
code = str(df.iloc[0,1])
name = df.iloc[-1,2].replace(' ','')
for i in range(len(df)): #循环访问每年的年报
title=df.iloc[i,3]
doc = fitz.open('./%s/%s.pdf'%(com,title))
text=''
for j in range(15):
page = doc[j]
text += page.get_text()
p_year=re.compile('.*?(\d{4}) .*?年度报告.*?')
year = int(p_year.findall(text)[0])
p_rev = re.compile('(?<=\n)营业总?收入(?\w?)?\s?\n?([\d+
,.]*)\s\n?')
p_eps = re.compile('(?<=\n)基本每股收益(元/?/?\n?股)\s?\n
?([-\d+,.]*)\s?\n?')
p_np = re.compile('(?<=\n)归属于上市公司股东的净利润(?\w?)?\
s?\n?([-\d+,.]*)\s?\n?')
p_site = re.compile('(?<=\n)\w*办公地址:?\s?\n?(.*?)\s?(?=\
n)',re.DOTALL)
p_web =re.compile('(?<=\n)公司\w*网址:?\s?\n?([a-zA-Z./:]*)
\s?(?=\n)',re.DOTALL)
revenue=float(p_rev.search(text).group(1).replace(',',''))
if year>2012:
pre_rev=final.loc[year-1,'营业收入(元)']
if pre_rev/revenue>2:
print('警告:%s%s营业收入下跌超过百分之50,可能出现问题,请
手动查看'%(com,title))
eps=p_eps.search(text).group(1)
final.loc[year,'营业收入(元)']=revenue
final.loc[year,'基本每股收益(元/股)']=eps
final.loc[year,'归属于上市公司股东的净利润(元)']=eps
final.to_csv('【%s】.csv' %com,encoding='utf-8-sig') #将各公司数据
存储到本地测csv文件
site=p_site.search(text).group(1) #匹配办公地址和网址(由于取最近一年
的,所以只要匹配一次不用循环匹配)
web=p_web.search(text).group(1)
with open('【%s】.csv'%com,'a',encoding='utf-8-sig') as f:
content='股票简称,%s\n股票代码,%s\n办公地址,%s\n公司网址,%s'%(nam
e,code,site,web)
f.write(content)
print(name+'数据已保存完毕'+'(',t,'/',len(company),')')
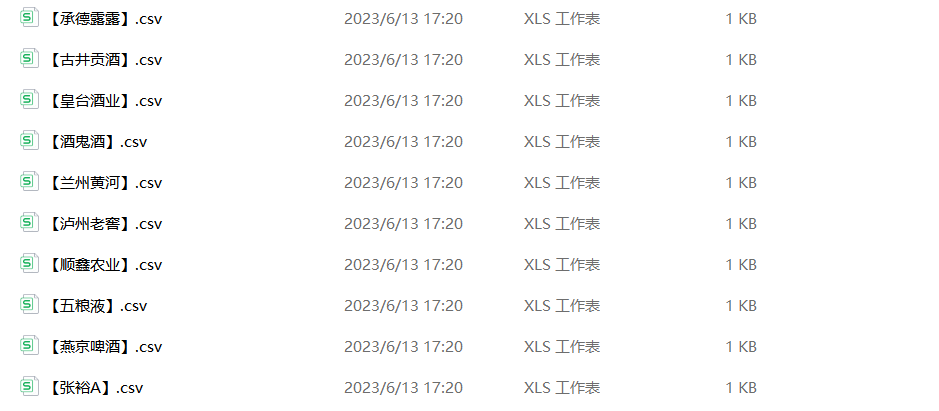
结果:存到本地的数据文件(csv格式)
结果如下:

利用获取的十个公司数据,绘制“营业收入(元)”、“基本每股收益(元 ╱ 股)”、 “归属于上市公司股东的净利润(元)”随时间变化趋势图
按每一年度,对该行业内公司“营业收入(元)”、“基本每股收益(元 ╱ 股)”、 “归属于上市公司股东的净利润(元)”绘制对比图
import pandas as pd
import matplotlib.pyplot as plt
Company=pd.read_csv('company.csv',).iloc[:,1:]
company=Company.iloc[:,1].tolist()
dflist=[]
for name in company:
com = name.replace('*','')
data=pd.read_csv('【'+com+'】.csv')
dflist.append(data) #将所有的csv文件保存到一个list里方便后续调用
comps = len(dflist)
for i in range(comps):
dflist[i]=dflist[i].set_index('年份')
def compare_rev(data):
df=pd.DataFrame(columns=['近十年总营业收入(元)'])
for i in range(comps):
df.loc[dflist[i].loc['股票简称','营业收入(元)'],'近十年总营业收
入(元)']=dflist[i].iloc[:11,0].astype(float).sum()
return df
rank=compare_rev(dflist).sort_values('近十年总营业收入(元)',ascending=
False).head(10)
names=['泸州老窖', '古井贡酒', '燕京啤酒', '酒鬼酒', '承德露露', '五粮液',
'顺鑫农业', '张裕A','兰州黄河', '*ST黄台']
indexes=[]
for idx in names:
indexes.append(company.index(idx))
datalist=[]
datalist1=[]
for i in indexes:
datalist.append(pd.DataFrame(dflist[i].iloc[:11,0]))
for df in datalist:
df.index=df.index.astype(int)
df['营业收入(元)']=df['营业收入(元)'].astype(float)/100000000
for i in indexes:
datalist1.append(pd.DataFrame(dflist[i].iloc[:11,1]))
for df in datalist1:
df.index=df.index.astype(int)
df['基本每股收益(元/股)']=df['基本每股收益(元/股)'].astype(float)
for i in indexes:
datalist.append(pd.DataFrame(dflist[i].iloc[:11,2]))
for df in datalist2:
df.index=df.index.astype(int)
df['归属于上市公司股东的净利润(元)']=df['归属于上市公司股东的净利润(元)']
.astype(float)/100000000
hori_rev=pd.concat(datalist,axis=1) #将所有公司的df合并成汇总表
hori_eps=pd.concat(datalist1,axis=1)
hori_np=pd.concat(datalist2,axis=1)
hori_rev.columns=rank.index
hori_eps.columns=rank.index
hori_np.columns=rank.index
#绘图
plt.rcParams['font.sans-serif']=['SimHei']
plt.figure(figsize=(16,30))
x = datalist[0].index
y1 = hori_rev.iloc[:,0]
y2 = hori_rev.iloc[:,1]
y3 = hori_rev.iloc[:,2]
y4 = hori_rev.iloc[:,3]
y5 = hori_rev.iloc[:,4]
y6 = hori_rev.iloc[:,5]
y7 = hori_rev.iloc[:,6]
y8 = hori_rev.iloc[:,7]
y9 = hori_rev.iloc[:,8]
y10 = hori_rev.iloc[:,9]
plt.xlim(2011,2023,1)
#plt.ylim()
plt.xticks(range(2011,2022),fontsize=18)
plt.yticks(fontsize=18)
plt.plot(x,y1, color='#9BCD9B',marker = 'o',markersize=7,linestyle='-',label=
'泸州老窖',linewidth =1,alpha=0.8)
plt.plot(x,y2,color='#1E90FF', marker='^',markersize=7, linestyle='-',label=
'古井贡酒',linewidth =1,alpha=0.8)
plt.plot(x,y3,color='#2E8B57', marker='*', markersize=7,linestyle='-',label=
'燕京啤酒',linewidth =1,alpha=0.8)
plt.plot(x,y4,color='#FF8C00', marker='x', markersize=7,linestyle='-',label=
'酒鬼酒',linewidth =1,alpha=0.8)
plt.plot(x,y5,color='#4682B4', marker='D', markersize=7,linestyle='-',label=
'承德露露',linewidth =1,alpha=0.8)
plt.plot(x,y6,color='#FF6A6A', marker='+', markersize=7,linestyle='-',label=
'五粮液',linewidth =1,alpha=0.8)
plt.plot(x,y7,color='#6495ED', marker='v', markersize=7,linestyle='-',label=
'顺鑫农业',linewidth =1,alpha=0.8)
plt.plot(x,y8,color='#FFB90F', marker='1', markersize=7,linestyle='-',label=
'张裕A',linewidth =1,alpha=0.8)
plt.plot(x,y9,color='#8B3A3A', marker='1', markersize=7,linestyle='-',label=
'兰州黄河',linewidth =1,alpha=0.8)
plt.plot(x,y10,color='#00CED1', marker='1', markersize=7,linestyle='-',label=
'*ST黄台',linewidth =1,alpha=0.8)
plt.legend(loc = "upper left",prop={'family':'simsun', 'size': 20},framealpha
=0.8) # 显示图例
plt.grid(True)
title="营业收入随时间变化趋势图(2012-2023)"
plt.title(title,fontsize=25)
plt.ylabel("营业收入(亿元)",fontsize=22) # 设置Y轴标签
plt.xlabel("年份",fontsize=22,loc='left') # 设置X轴标签
plt.show()
plt.rcParams['font.sans-serif']=['SimHei']
plt.rcParams['axes.unicode_minus']=False
plt.figure(figsize=(18,24))
x = datalist[0].index
#y = range(len(names_y))
y1 = hori_eps.iloc[:,0]
y2 = hori_eps.iloc[:,1]
y3 = hori_eps.iloc[:,2]
y4 = hori_eps.iloc[:,3]
y5 = hori_eps.iloc[:,4]
y6 = hori_eps.iloc[:,5]
y7 = hori_eps.iloc[:,6]
y8 = hori_eps.iloc[:,7]
y9 = hori_eps.iloc[:,8]
y10 = hori_eps.iloc[:,9]
plt.xlim(2011,2023,1)
#plt.ylim()
plt.xticks(range(2012,2023),fontsize=18)
plt.yticks(fontsize=18)
plt.plot(x,y1, color='#9BCD9B',marker = 'o',markersize=7,linestyle='-',label=
'泸州老窖',linewidth =1,alpha=0.8)
plt.plot(x,y2,color='#1E90FF', marker='^',markersize=7, linestyle='-',label=
'古井贡酒',linewidth =1,alpha=0.8)
plt.plot(x,y3,color='#2E8B57', marker='*', markersize=7,linestyle='-',label=
'燕京啤酒',linewidth =1,alpha=0.8)
plt.plot(x,y4,color='#FF8C00', marker='x', markersize=7,linestyle='-',label=
'酒鬼酒',linewidth =1,alpha=0.8)
plt.plot(x,y5,color='#4682B4', marker='D', markersize=7,linestyle='-',label=
'承德露露',linewidth =1,alpha=0.8)
plt.plot(x,y6,color='#FF6A6A', marker='+', markersize=7,linestyle='-',label=
'五粮液',linewidth =1,alpha=0.8)
plt.plot(x,y7,color='#6495ED', marker='v', markersize=7,linestyle='-',label=
'顺鑫农业',linewidth =1,alpha=0.8)
plt.plot(x,y8,color='#FFB90F', marker='1', markersize=7,linestyle='-',label=
'张裕A',linewidth =1,alpha=0.8)
plt.plot(x,y9,color='#8B3A3A', marker='1', markersize=7,linestyle='-',label=
'兰州黄河',linewidth =1,alpha=0.8)
plt.plot(x,y10,color='#00CED1', marker='1', markersize=7,linestyle='-',label=
'*ST黄台',linewidth =1,alpha=0.8)
plt.legend(loc = "upper left",prop={'family':'simsun', 'size': 20},framealpha
=0.8) # 显示图例
plt.grid(True)
title="基本每股收益随时间变化趋势图(2013-2022)"
plt.title(title,fontsize=25)
plt.ylabel("基本每股收益(元/股)",fontsize=22) # 设置Y轴标签
plt.xlabel("年份",fontsize=22) # 设置X轴标签
plt.show()
plt.rcParams['font.sans-serif']=['SimHei']
plt.figure(figsize=(16,30))
x = datalist[0].index
y1 = hori_np.iloc[:,0]
y2 = hori_np.iloc[:,1]
y3 = hori_np.iloc[:,2]
y4 = hori_np.iloc[:,3]
y5 = hori_np.iloc[:,4]
y6 = hori_np.iloc[:,5]
y7 = hori_np.iloc[:,6]
y8 = hori_np.iloc[:,7]
y9 = hori_np.iloc[:,8]
y10 = hori_np.iloc[:,9]
plt.xlim(2011,2023,1)
#plt.ylim()
plt.xticks(range(2011,2022),fontsize=18)
plt.yticks(fontsize=18)
plt.plot(x,y1, color='#9BCD9B',marker = 'o',markersize=7,linestyle='-',label=
'泸州老窖',linewidth =1,alpha=0.8)
plt.plot(x,y2,color='#1E90FF', marker='^',markersize=7, linestyle='-',label=
'古井贡酒',linewidth =1,alpha=0.8)
plt.plot(x,y3,color='#2E8B57', marker='*', markersize=7,linestyle='-',label=
'燕京啤酒',linewidth =1,alpha=0.8)
plt.plot(x,y4,color='#FF8C00', marker='x', markersize=7,linestyle='-',label=
'酒鬼酒',linewidth =1,alpha=0.8)
plt.plot(x,y5,color='#4682B4', marker='D', markersize=7,linestyle='-',label=
'承德露露',linewidth =1,alpha=0.8)
plt.plot(x,y6,color='#FF6A6A', marker='+', markersize=7,linestyle='-',label=
'五粮液',linewidth =1,alpha=0.8)
plt.plot(x,y7,color='#6495ED', marker='v', markersize=7,linestyle='-',label=
'顺鑫农业',linewidth =1,alpha=0.8)
plt.plot(x,y8,color='#FFB90F', marker='1', markersize=7,linestyle='-',label=
'张裕A',linewidth =1,alpha=0.8)
plt.plot(x,y9,color='#8B3A3A', marker='1', markersize=7,linestyle='-',label=
'兰州黄河',linewidth =1,alpha=0.8)
plt.plot(x,y10,color='#00CED1', marker='1', markersize=7,linestyle='-',label=
'*ST黄台',linewidth =1,alpha=0.8)
plt.legend(loc = "upper left",prop={'family':'simsun', 'size': 20},framealpha
=0.8) # 显示图例
plt.grid(True)
title="归属于上市公司股东的净利润趋势图(2013-2022)"
plt.title(title,fontsize=25)
plt.ylabel("归属于上市公司股东的净利润(亿元)",fontsize=22) # 设置Y轴标签
plt.xlabel("年份",fontsize=22) # 设置X轴标签
plt.show()
hori_revup=hori_rev.head(10)
hori_epsup=hori_eps.head(10)
plt.rcParams['font.sans-serif']=['SimHei']
plt.rcParams['axes.unicode_minus']=False
ax1=hori_revup.plot(kind='bar',figsize=(16,8),fontsize=18,alpha=0.7,grid=True)
ax1.legend(loc='best',prop={'family':'simsun', 'size': 14},framealpha=0.5)
ax1.set_xlabel('年份',loc='left',fontsize=18)
ax1.set_ylabel('营业收入(十亿元)',fontsize=18)
ax1.set_title('行业内横向对比营业收入(2013-2022)',fontsize=20)
ax1.figure.savefig('1')
ax2=hori_epsup.plot(kind='bar',figsize=(18,10),fontsize=18,grid=True,alpha=0.7)
ax2.legend(loc='best',prop={'family':'simsun', 'size': 14},framealpha=0.7)
ax2.set_xlabel('年份',loc='right',fontsize=18)
ax2.set_ylabel('基本每股收益(元/股)',fontsize=18)
ax2.set_title('行业内横向对比基本每股收益(2011-2014)',fontsize=20)
ax2.figure.savefig('2')
ax3=hori_epsup.plot(kind='bar',figsize=(18,10),fontsize=18,grid=True,alpha=0.7)
ax3.legend(loc='best',prop={'family':'simsun', 'size': 14},framealpha=0.7)
ax3.set_xlabel('年份',loc='right',fontsize=18)
ax3.set_ylabel('归属于上市公司股东的净利润(亿元)',fontsize=18)
ax3.set_title('行业内横向对比归属于上市公司股东的净利润(2012-2023)',fontsize=20)
ax3.figure.savefig('3')
绘图结果
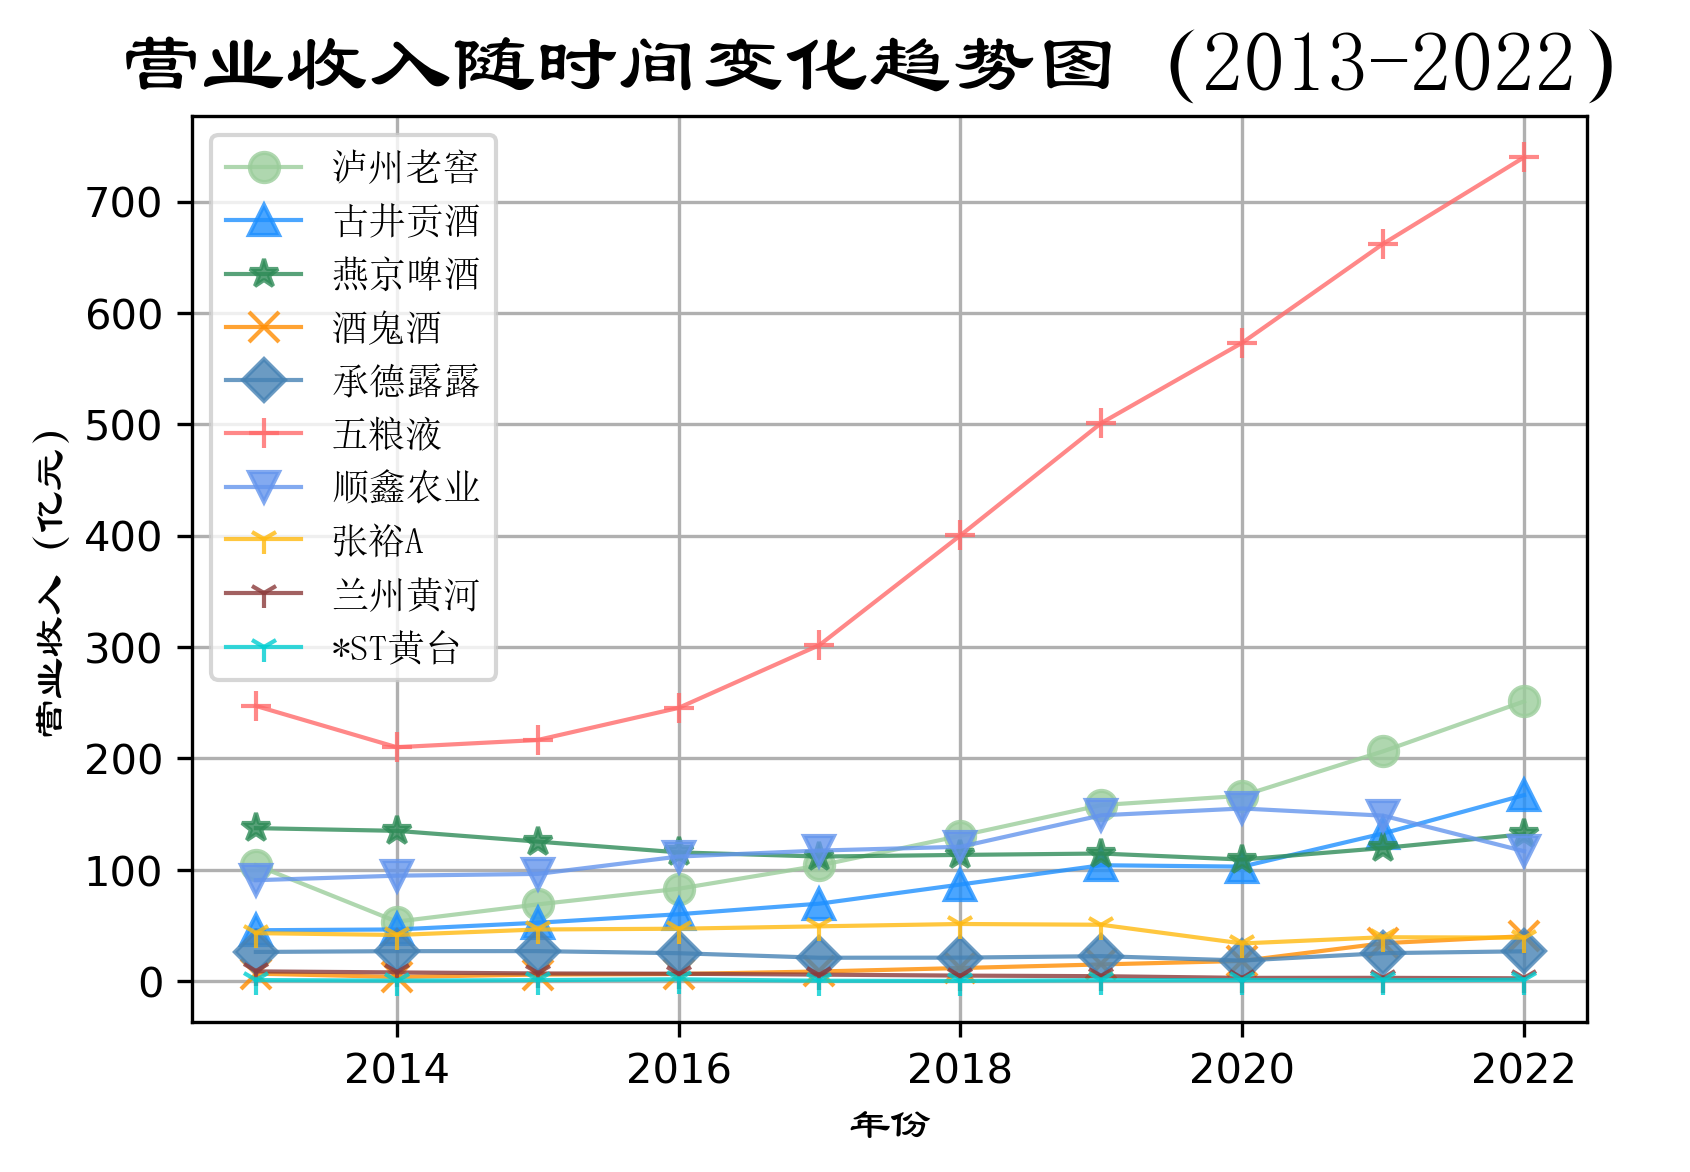
酒、饮料和精制茶制造业的十家公司的“营业收入(元)”随时间变化趋势图📈
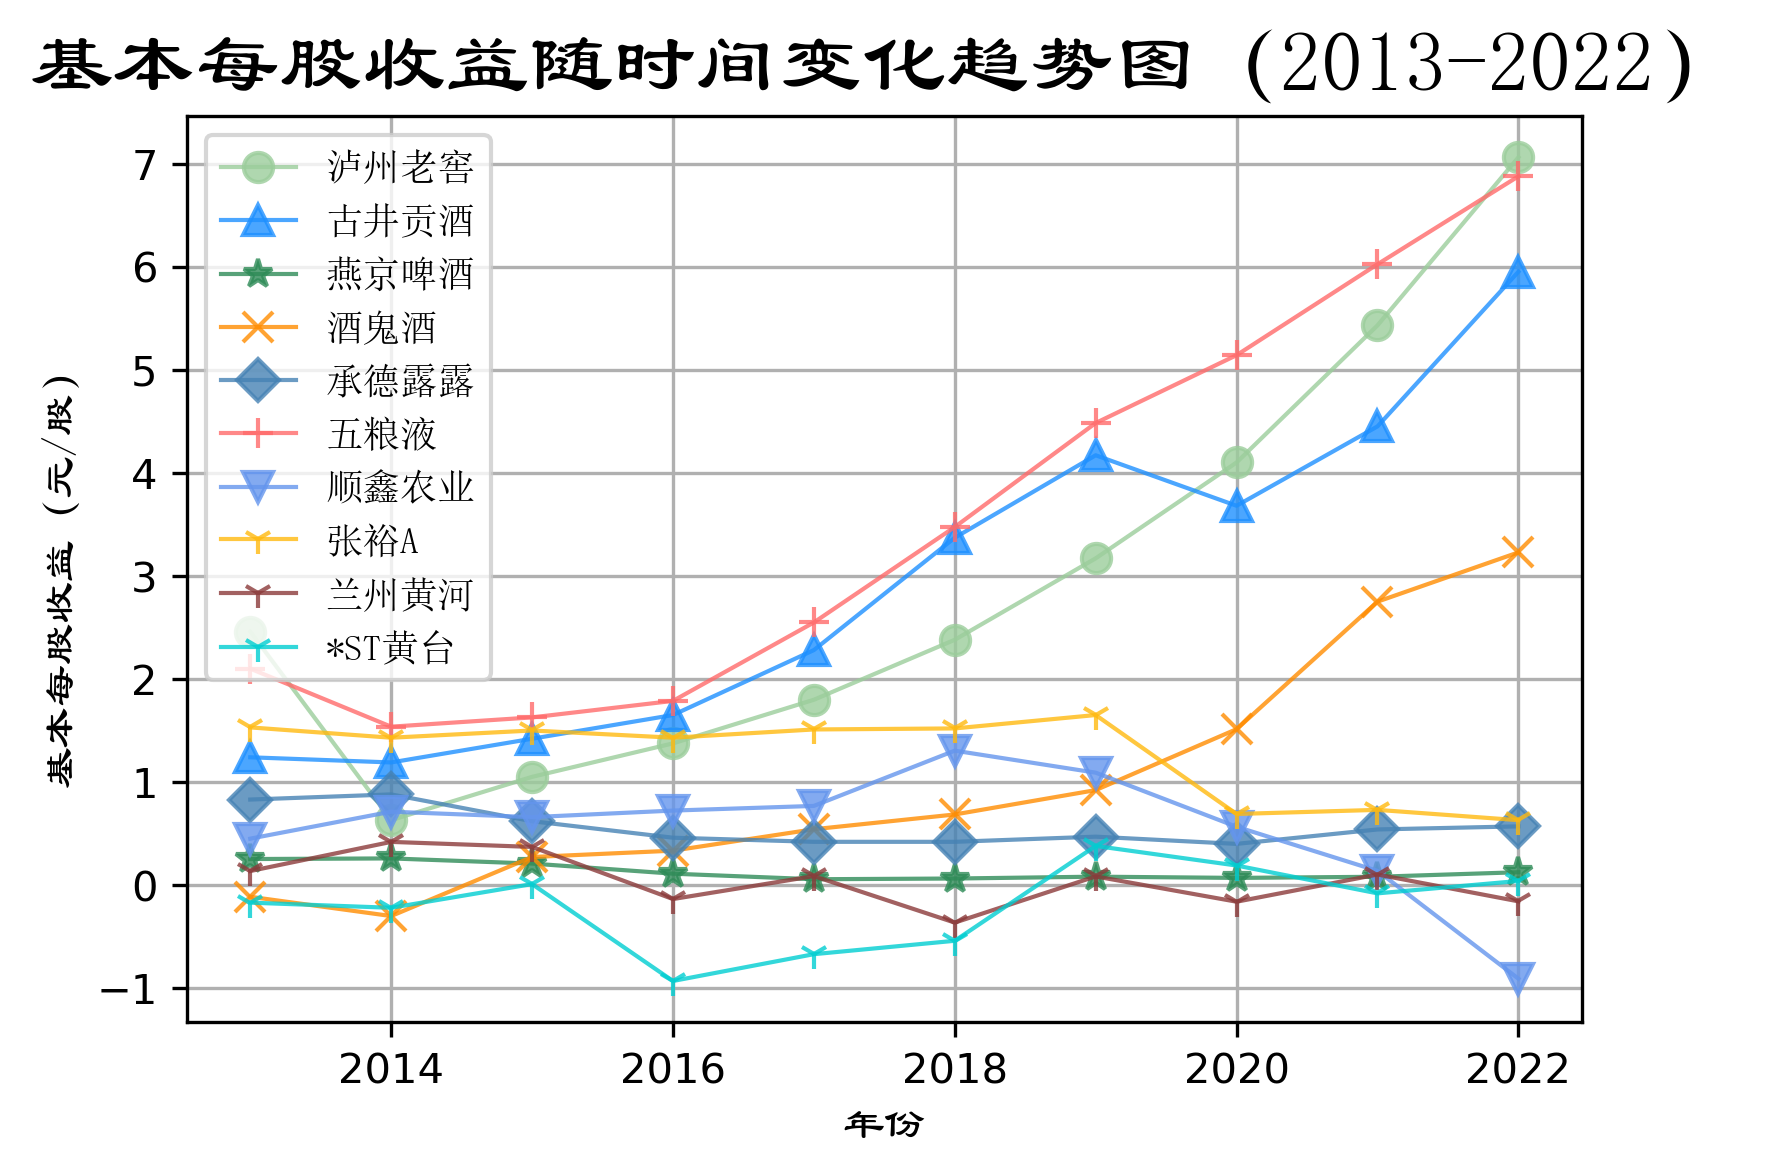
酒、饮料和精制茶制造业十家公司的“基本每股收益(元 ╱ 股)”随时间变化趋势图”📉
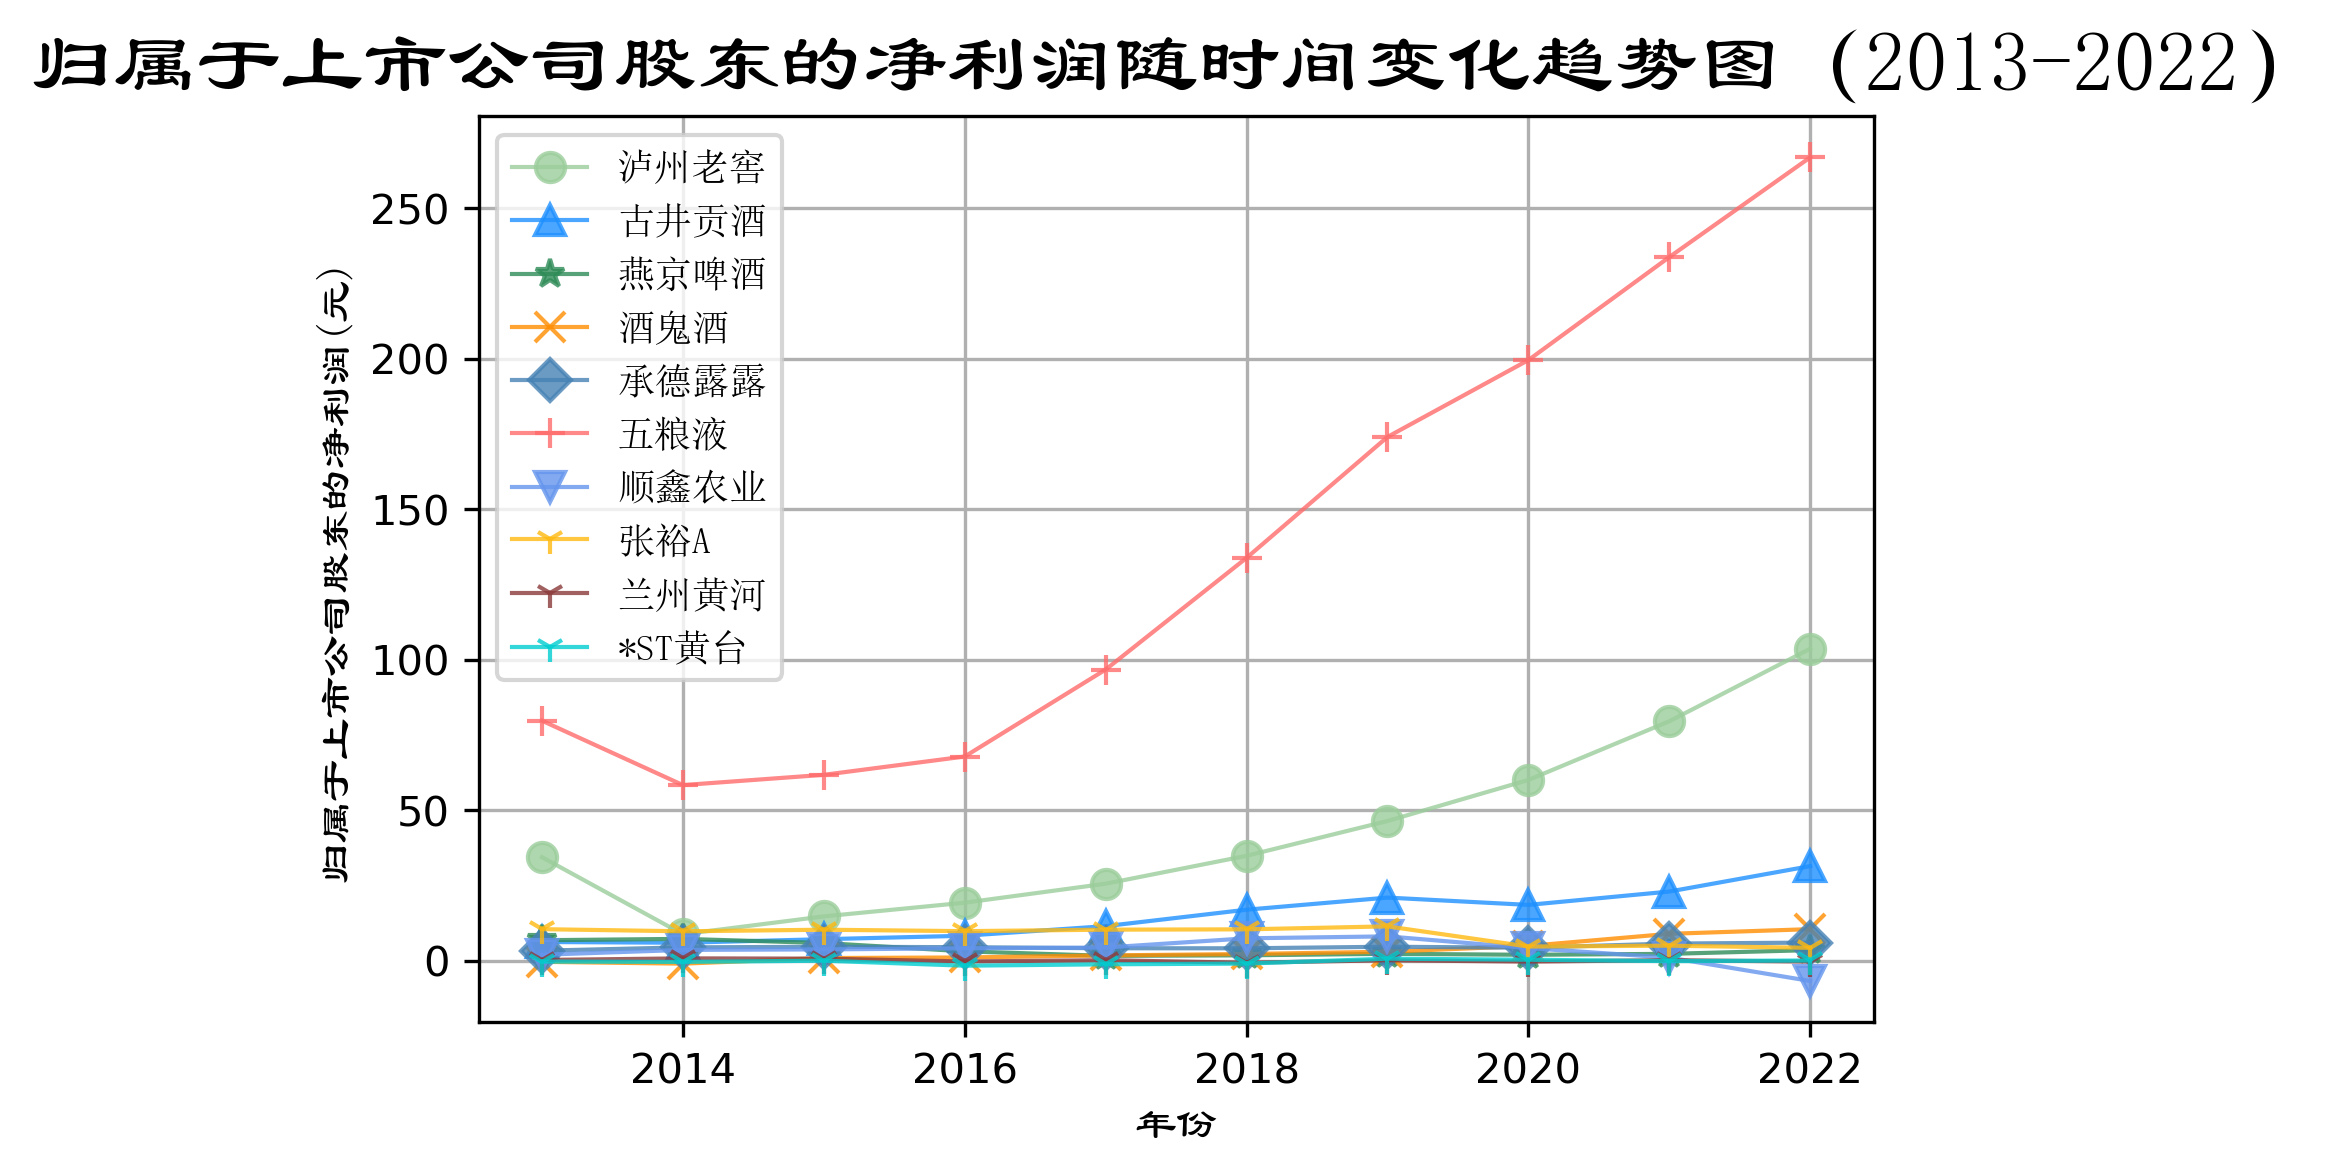
酒、饮料和精制茶制造业十家公司的“归属于上市公司股东的净利润(元)”随时间变化趋势图” 📉
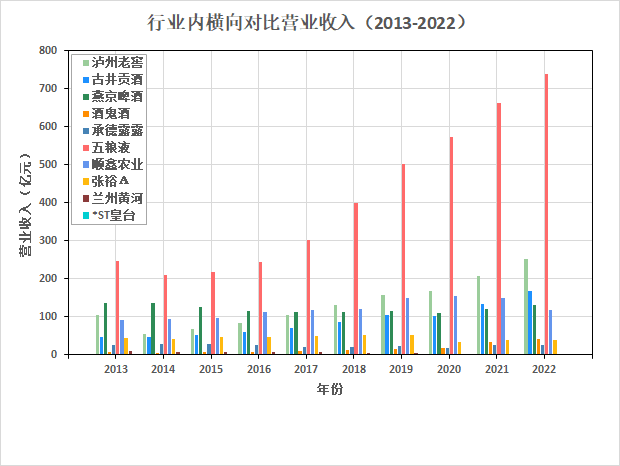
按每一年度,酒、饮料和精制茶制造业上市公司“营业收入(元)”对比图📊
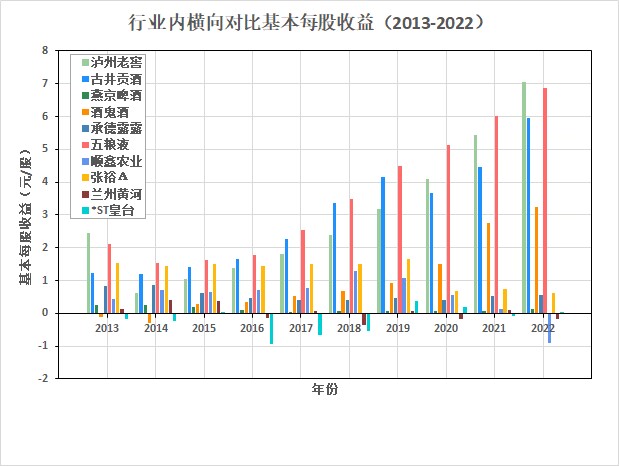
按每一年度,酒、饮料和精制茶制造业上市公司“基本每股收益(元 ╱ 股)”对比图📊
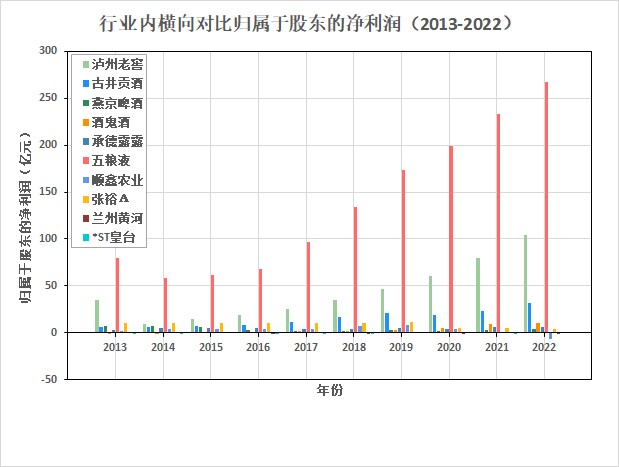
按每一年度,酒、饮料和精制茶制造业上市公司“归属于上市公司股东的净利润(元)”对比图📊
Ⅱ.实验结果分析与理解📝
- 1.营业收入分析与理解
- 2.每股收益分析与理解
- 3.归属于上市公司的股东的净利润分析与理解
根据营业收入随时间变化的趋势图,目前酒、饮料和精致茶制造业的龙头企业是五粮液。
在2013-2022年,五粮液一直处于总营业收入第一的地位,处于200亿元以上的水平。而泸州老窖则处于
第二梯队,处于50亿元以上的水平。两者的产品都以川派浓香为主,都定位为高端白酒,但五粮液的营
业收入明显高于泸州老窖,可见五粮液企业的市场份额更高。两者在2014年营业收入都有所降低,是因
为14年白酒市场竞争压力大,供应过剩,是的价格波动较大。
古井贡酒、燕京啤酒、顺鑫农业也处于第二梯队,与五粮液不同的是,五粮液在2022年将这三家企业远
远甩在身后,达到250亿元,其他的在150亿元左右。其中,五粮液、古井贡酒和燕京啤酒都以上升趋势
为主,顺鑫农业则在2020年后呈下降趋势,其主要业务是白酒酿造和销售、种猪繁殖和房地产开发,可
能是因为猪肉价格波动较大。
剩余企业处于第三梯队,营业收入未达到50亿元。且在观测期间内,营业收入较为稳定。
在疫情三年,消费市场整体不乐观,但白酒企业却逆势增长,表现抢眼。该行业五粮液一家独大,要注意
的是产生马太效应。
营业收入可以看见一个公司的规模,而每股收益可以看出公司的盈利能力和经营成果。每股收益是税后
利润与股本总数的比率。也即每股能带来的利润。
根据每股收益随时间趋势变化图,可以观察到酒、饮料和精致茶制造业的企业盈利能力较强——大部分公
司每股收益都在0以上,且波动性不大。在2014年都有小幅下降。
五粮液、泸州老窖和古井贡酒企业规模较大,其每股收益也较大,上升趋势较为明显。而燕京啤酒、顺鑫农
业尽管规模较大,但是其每股收益表现较差,尤其是顺鑫农业在近三年连续下降,在2022年下降到-1。相
反的,酒鬼酒尽管规模不大,但其每股收益表现良好,在近三年上升势头较猛。
酒、饮料和精致茶制造业会受到价格波动和成本上升的影响,不同企业的盈利能力不同,规模越大的企业并
不是盈利能力越强。
营业收入减去成本和税收便是净利润,净利润反映了一个公司经营的最终成果。
根据归属于上市公司的股东的净利润随时间趋势变化图,可以观察到酒、饮料和精致茶制造业的企业的净利
润与营业收入趋势相同。
第一梯队为五粮液,第二梯队为泸州老窖,第三梯队为古井贡酒,第四梯对为剩余七家企业,其中顺鑫农业
的净利润近几年呈亏损状态,企业发展不理想。
该行业五粮液是占绝大份额,泸州老窖占一部分份额,剩余企业瓜分剩余份额。五粮液和泸州老窖规模较大
且发展较为稳定,在未来几年内将稳定增长。剩余企业中古井贡酒和酒鬼酒发展势头好,但难以撼动前两位
企业的份额。
Ⅲ.附录
1.实验心得💡
第一次完全用python完成一系列任务,包括爬虫,数据整理,数据提取和绘图等内容。从中优化了对爬虫,
正则和表达式和文件读写的理解,并学会了相应技能,更亲身体会到了自动化的强大之处。
在完成作业时,对于方法问题都能通过学习和搜集信息解决,提高了自学能力。对于编程问题,要仔细和耐
心,有时只是简单的数据类型错误或者表达式和函数运用不规范。同时,在解决实际问题时,不能限制住自
己的思维,要发散思维,可能会有更简单的解决方式。